Pictorial Tour of TBAD
Click on any image for full-size, which may also allow you to zoom via browser tools.
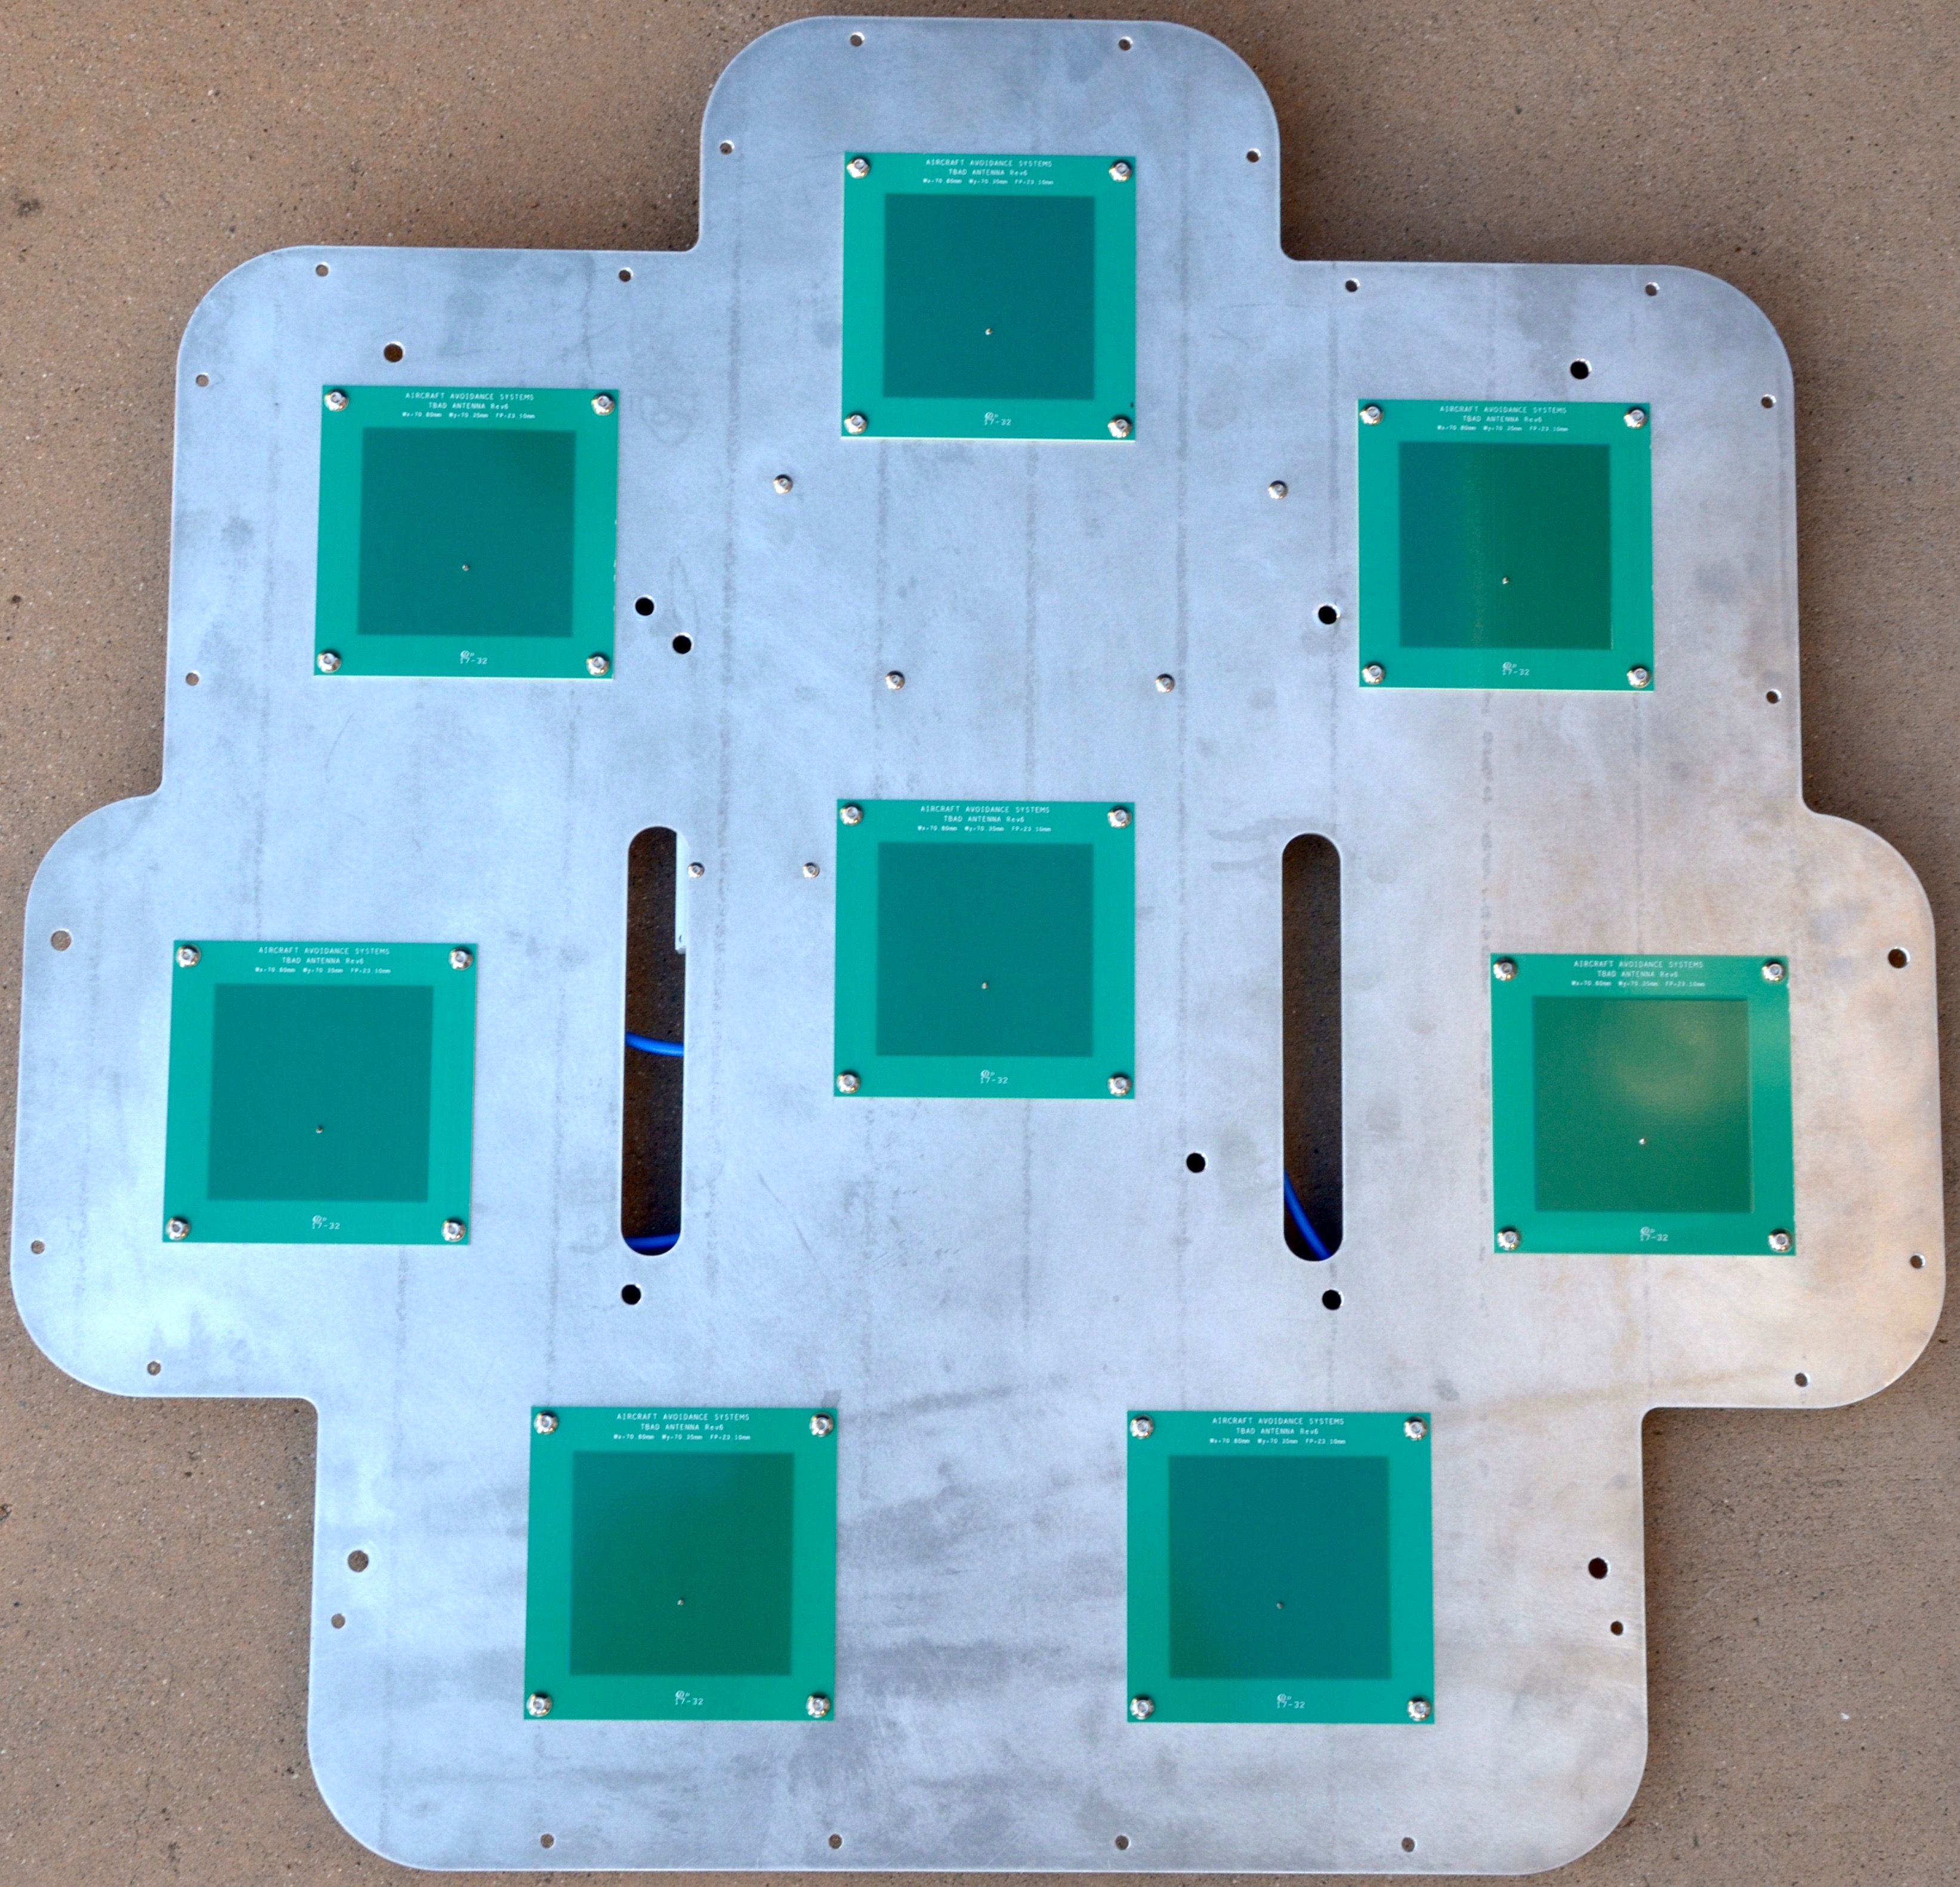
The TBAD antenna is a phased array of 8 (7 in older designs) patch
antennas. Each patch is a relatively narrow-band antenna tuned to
1090 MHz. The metal mounting plate provides a continuous ground plane
for all antennas, and the slots are present to help reduce wind-loading. A
look at the back of the antenna helps understand TBAD's fundamental
operating principle.
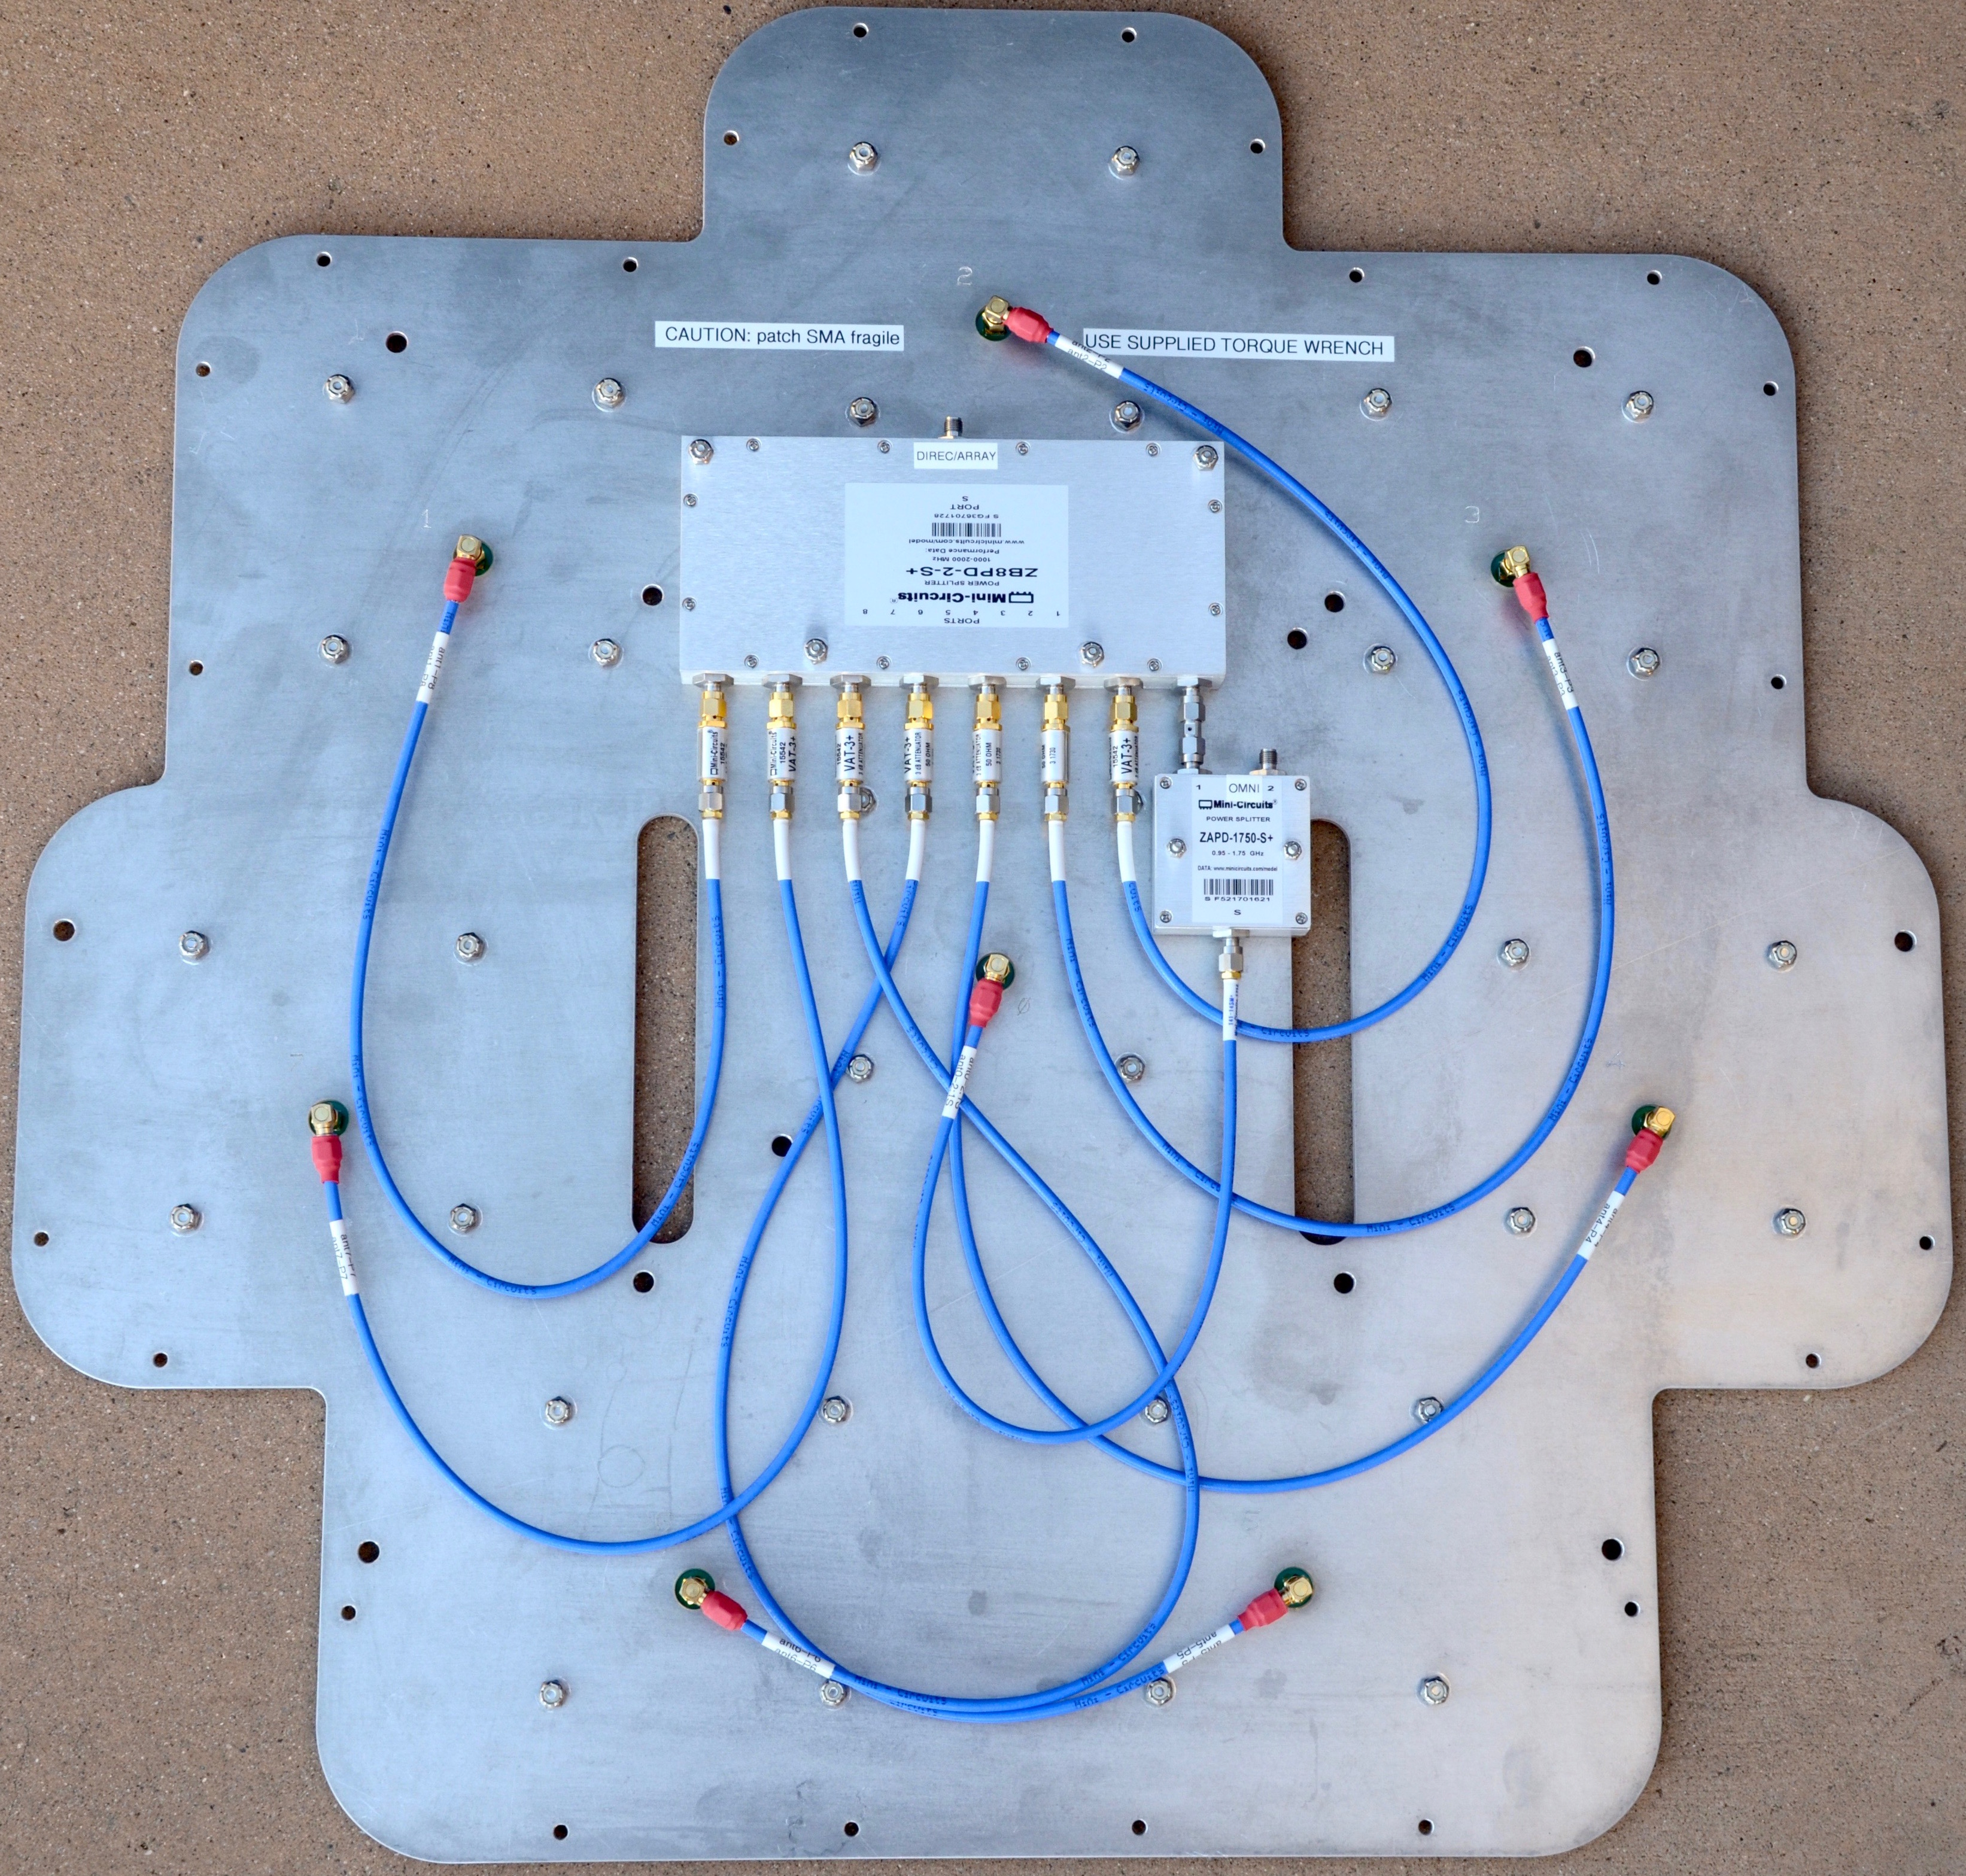 Much of TBAD's robustness comes from attention to the ratio of
signal from the entire array compared to that of a single patch. This
ratio is sensitive to the angular position of the source relative to the
antenna normal (boresight), but insensitive to source distance,
power, or polarization. The central patch serves two roles: member of the
antenna array, and single patch for the ratio comparison. Tracing the
cable from the central patch, we see it hit a 2:1 (−3 dB)
splitter. One output of the splitter is available as the single-patch
reference, and the other feeds the 8:1 summer (splitter run backwards)
together with all the other patches—each having a −3 dB
attenuator to bring in line with the splitter output. Thus the output of
the 8:1 summer is the phased combination of all patches forming a
directionally concentrated beam response. Now we look at the resulting
ratio pattern.
Much of TBAD's robustness comes from attention to the ratio of
signal from the entire array compared to that of a single patch. This
ratio is sensitive to the angular position of the source relative to the
antenna normal (boresight), but insensitive to source distance,
power, or polarization. The central patch serves two roles: member of the
antenna array, and single patch for the ratio comparison. Tracing the
cable from the central patch, we see it hit a 2:1 (−3 dB)
splitter. One output of the splitter is available as the single-patch
reference, and the other feeds the 8:1 summer (splitter run backwards)
together with all the other patches—each having a −3 dB
attenuator to bring in line with the splitter output. Thus the output of
the 8:1 summer is the phased combination of all patches forming a
directionally concentrated beam response. Now we look at the resulting
ratio pattern.
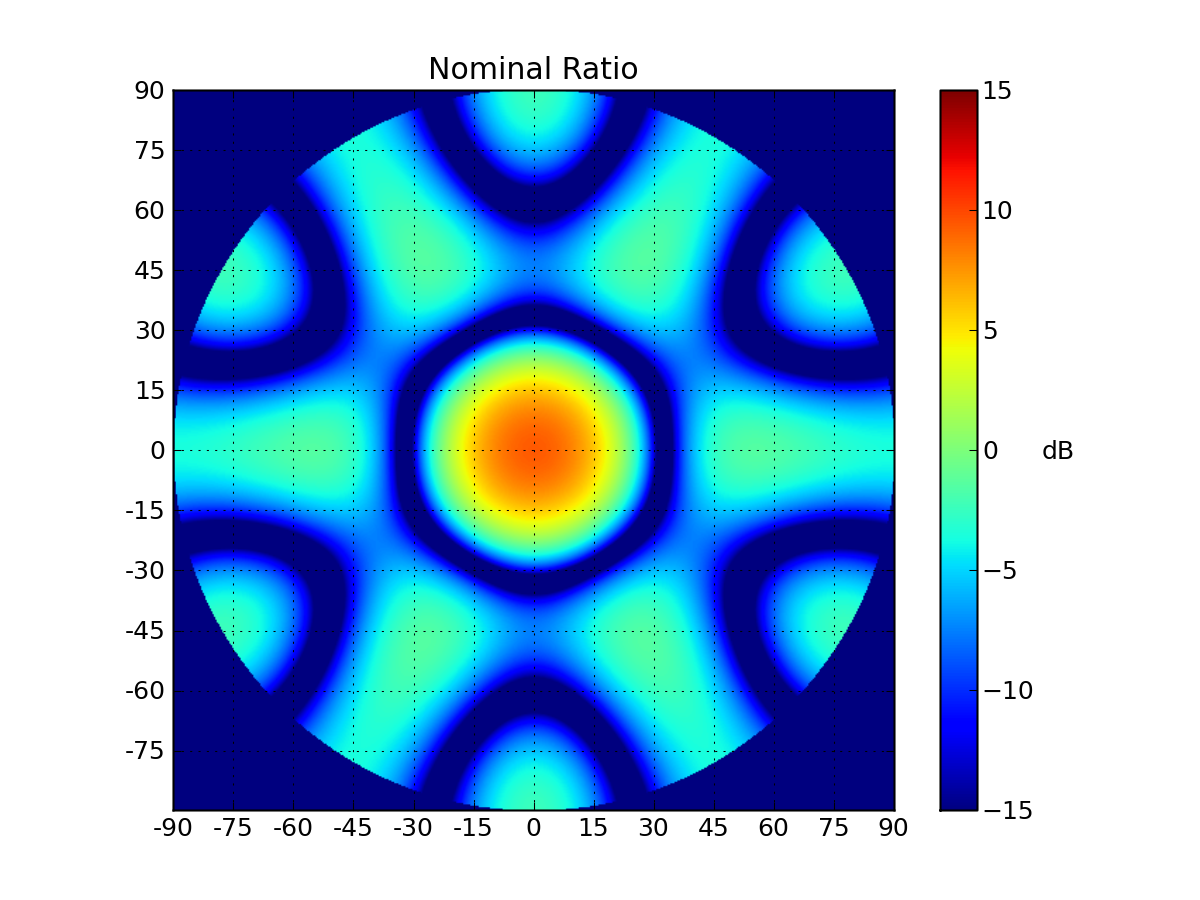
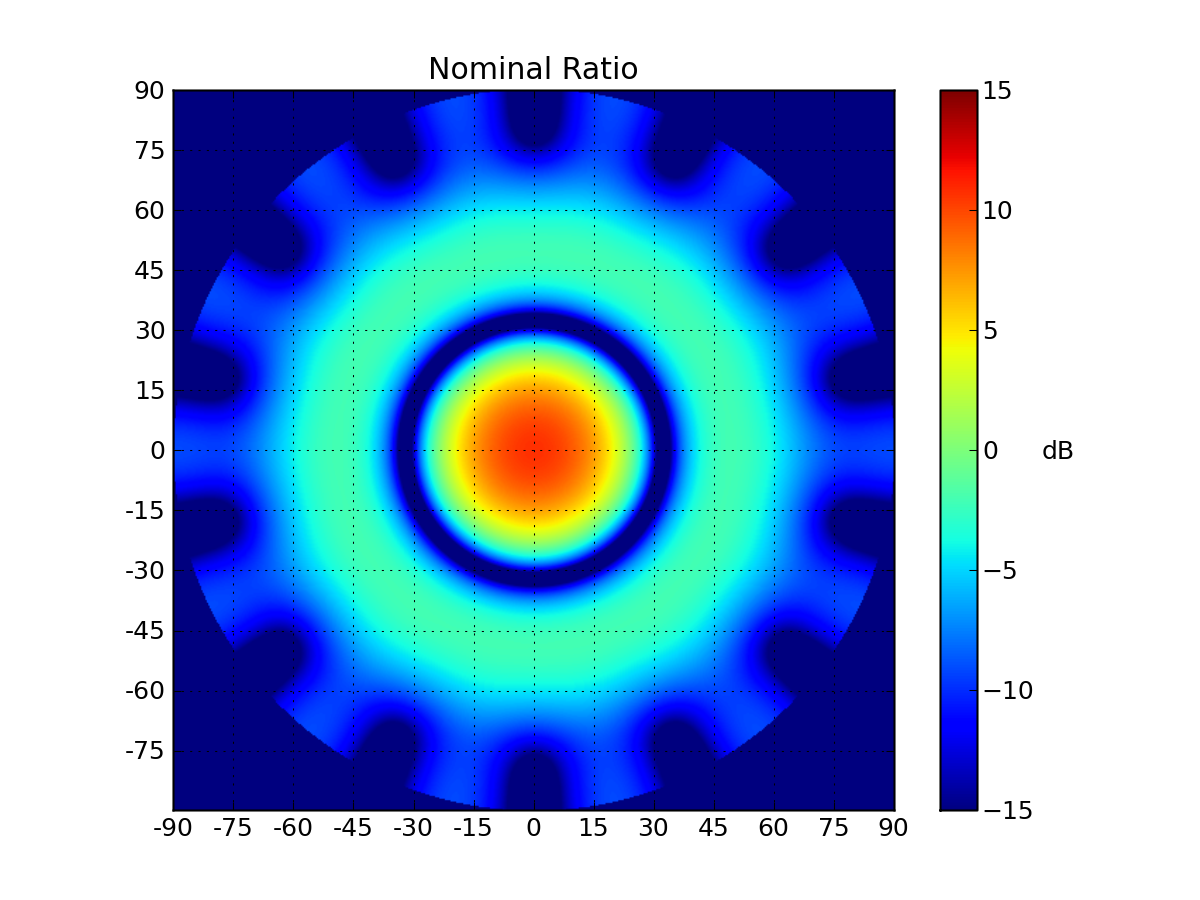 The ratio between array and single-patch signals as a function of angle in
the sky is sharply peaked around the antenna normal. Setting a threshold
at, say, 5 dB (ratio of 3.16) safely differentiates between
transmissions within the central region and those elsewhere. The older
7-element array design (six-fold symmetry) had poorer azimuthal uniformity
(seen here) but still isolated the central
zone well. Below we see cuts through the pattern in a more traditional
format.
The ratio between array and single-patch signals as a function of angle in
the sky is sharply peaked around the antenna normal. Setting a threshold
at, say, 5 dB (ratio of 3.16) safely differentiates between
transmissions within the central region and those elsewhere. The older
7-element array design (six-fold symmetry) had poorer azimuthal uniformity
(seen here) but still isolated the central
zone well. Below we see cuts through the pattern in a more traditional
format.
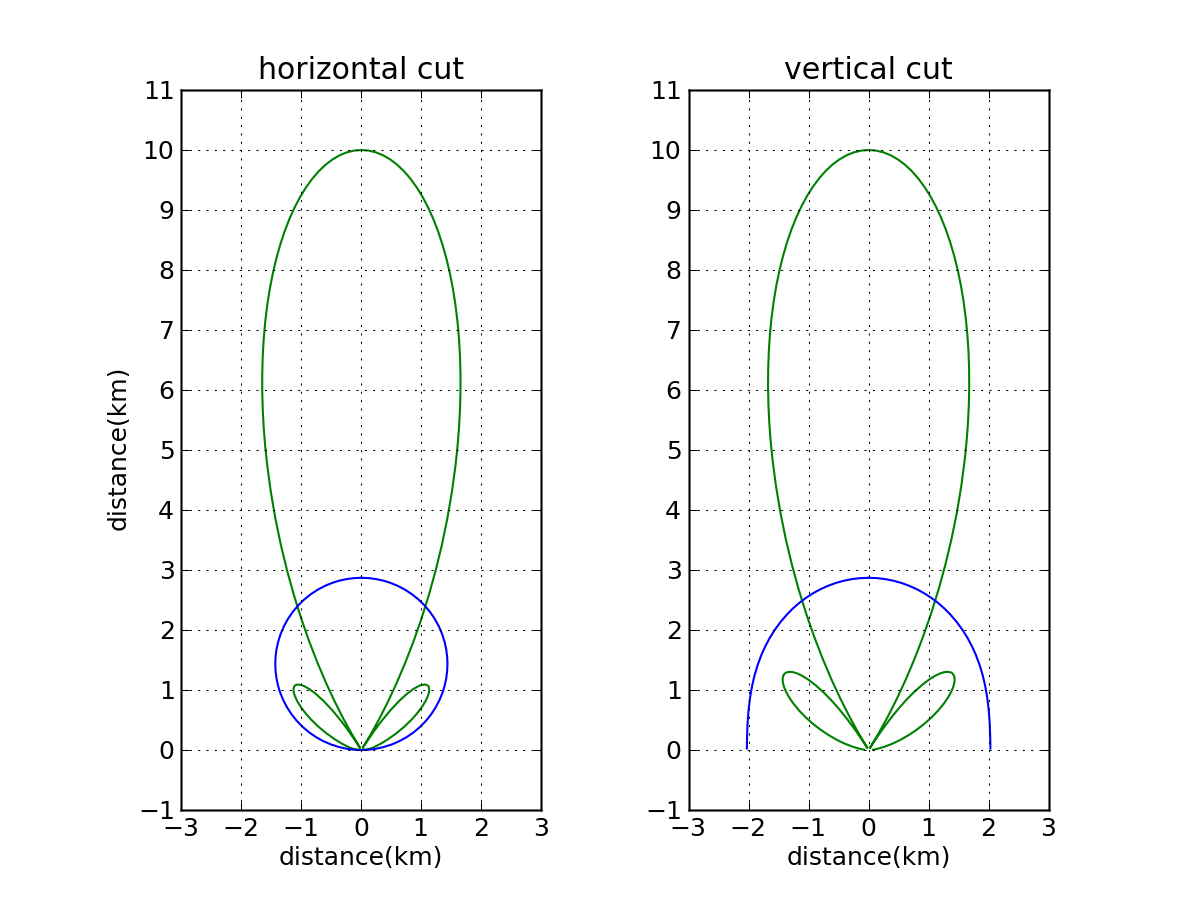 Expressed in terms of distance (normalized to 10 km, though TBAD can
go to 200 km if needed), the beam patterns appear as shown here. The
green curves correspond to the directional
array, while the blue curve represents the single
patch (often called "OMNI" in TBAD parlance, though not strictly
omni-directional). Yes, there are sidelobes, but that's where the ratio
comes in: only where the green curve exceeds the
blue curve is the ratio greater than one.
Expressed in terms of distance (normalized to 10 km, though TBAD can
go to 200 km if needed), the beam patterns appear as shown here. The
green curves correspond to the directional
array, while the blue curve represents the single
patch (often called "OMNI" in TBAD parlance, though not strictly
omni-directional). Yes, there are sidelobes, but that's where the ratio
comes in: only where the green curve exceeds the
blue curve is the ratio greater than one.
 This is a measurement of the reflection coefficient for a single patch,
showing the narrow-band nature of the antenna elements. Each division is
10 MHz horizontally, so the −10 dB points (corresponding to
10% reflection, or 90% transmission) span about 10 MHz and the
−3 dB points (50% reflection) span 26 MHz. A narrow-band
filter in the system additionally suppresses any transmissions more than
100 MHz from 1090 MHz by more than −70 dB.
This is a measurement of the reflection coefficient for a single patch,
showing the narrow-band nature of the antenna elements. Each division is
10 MHz horizontally, so the −10 dB points (corresponding to
10% reflection, or 90% transmission) span about 10 MHz and the
−3 dB points (50% reflection) span 26 MHz. A narrow-band
filter in the system additionally suppresses any transmissions more than
100 MHz from 1090 MHz by more than −70 dB.
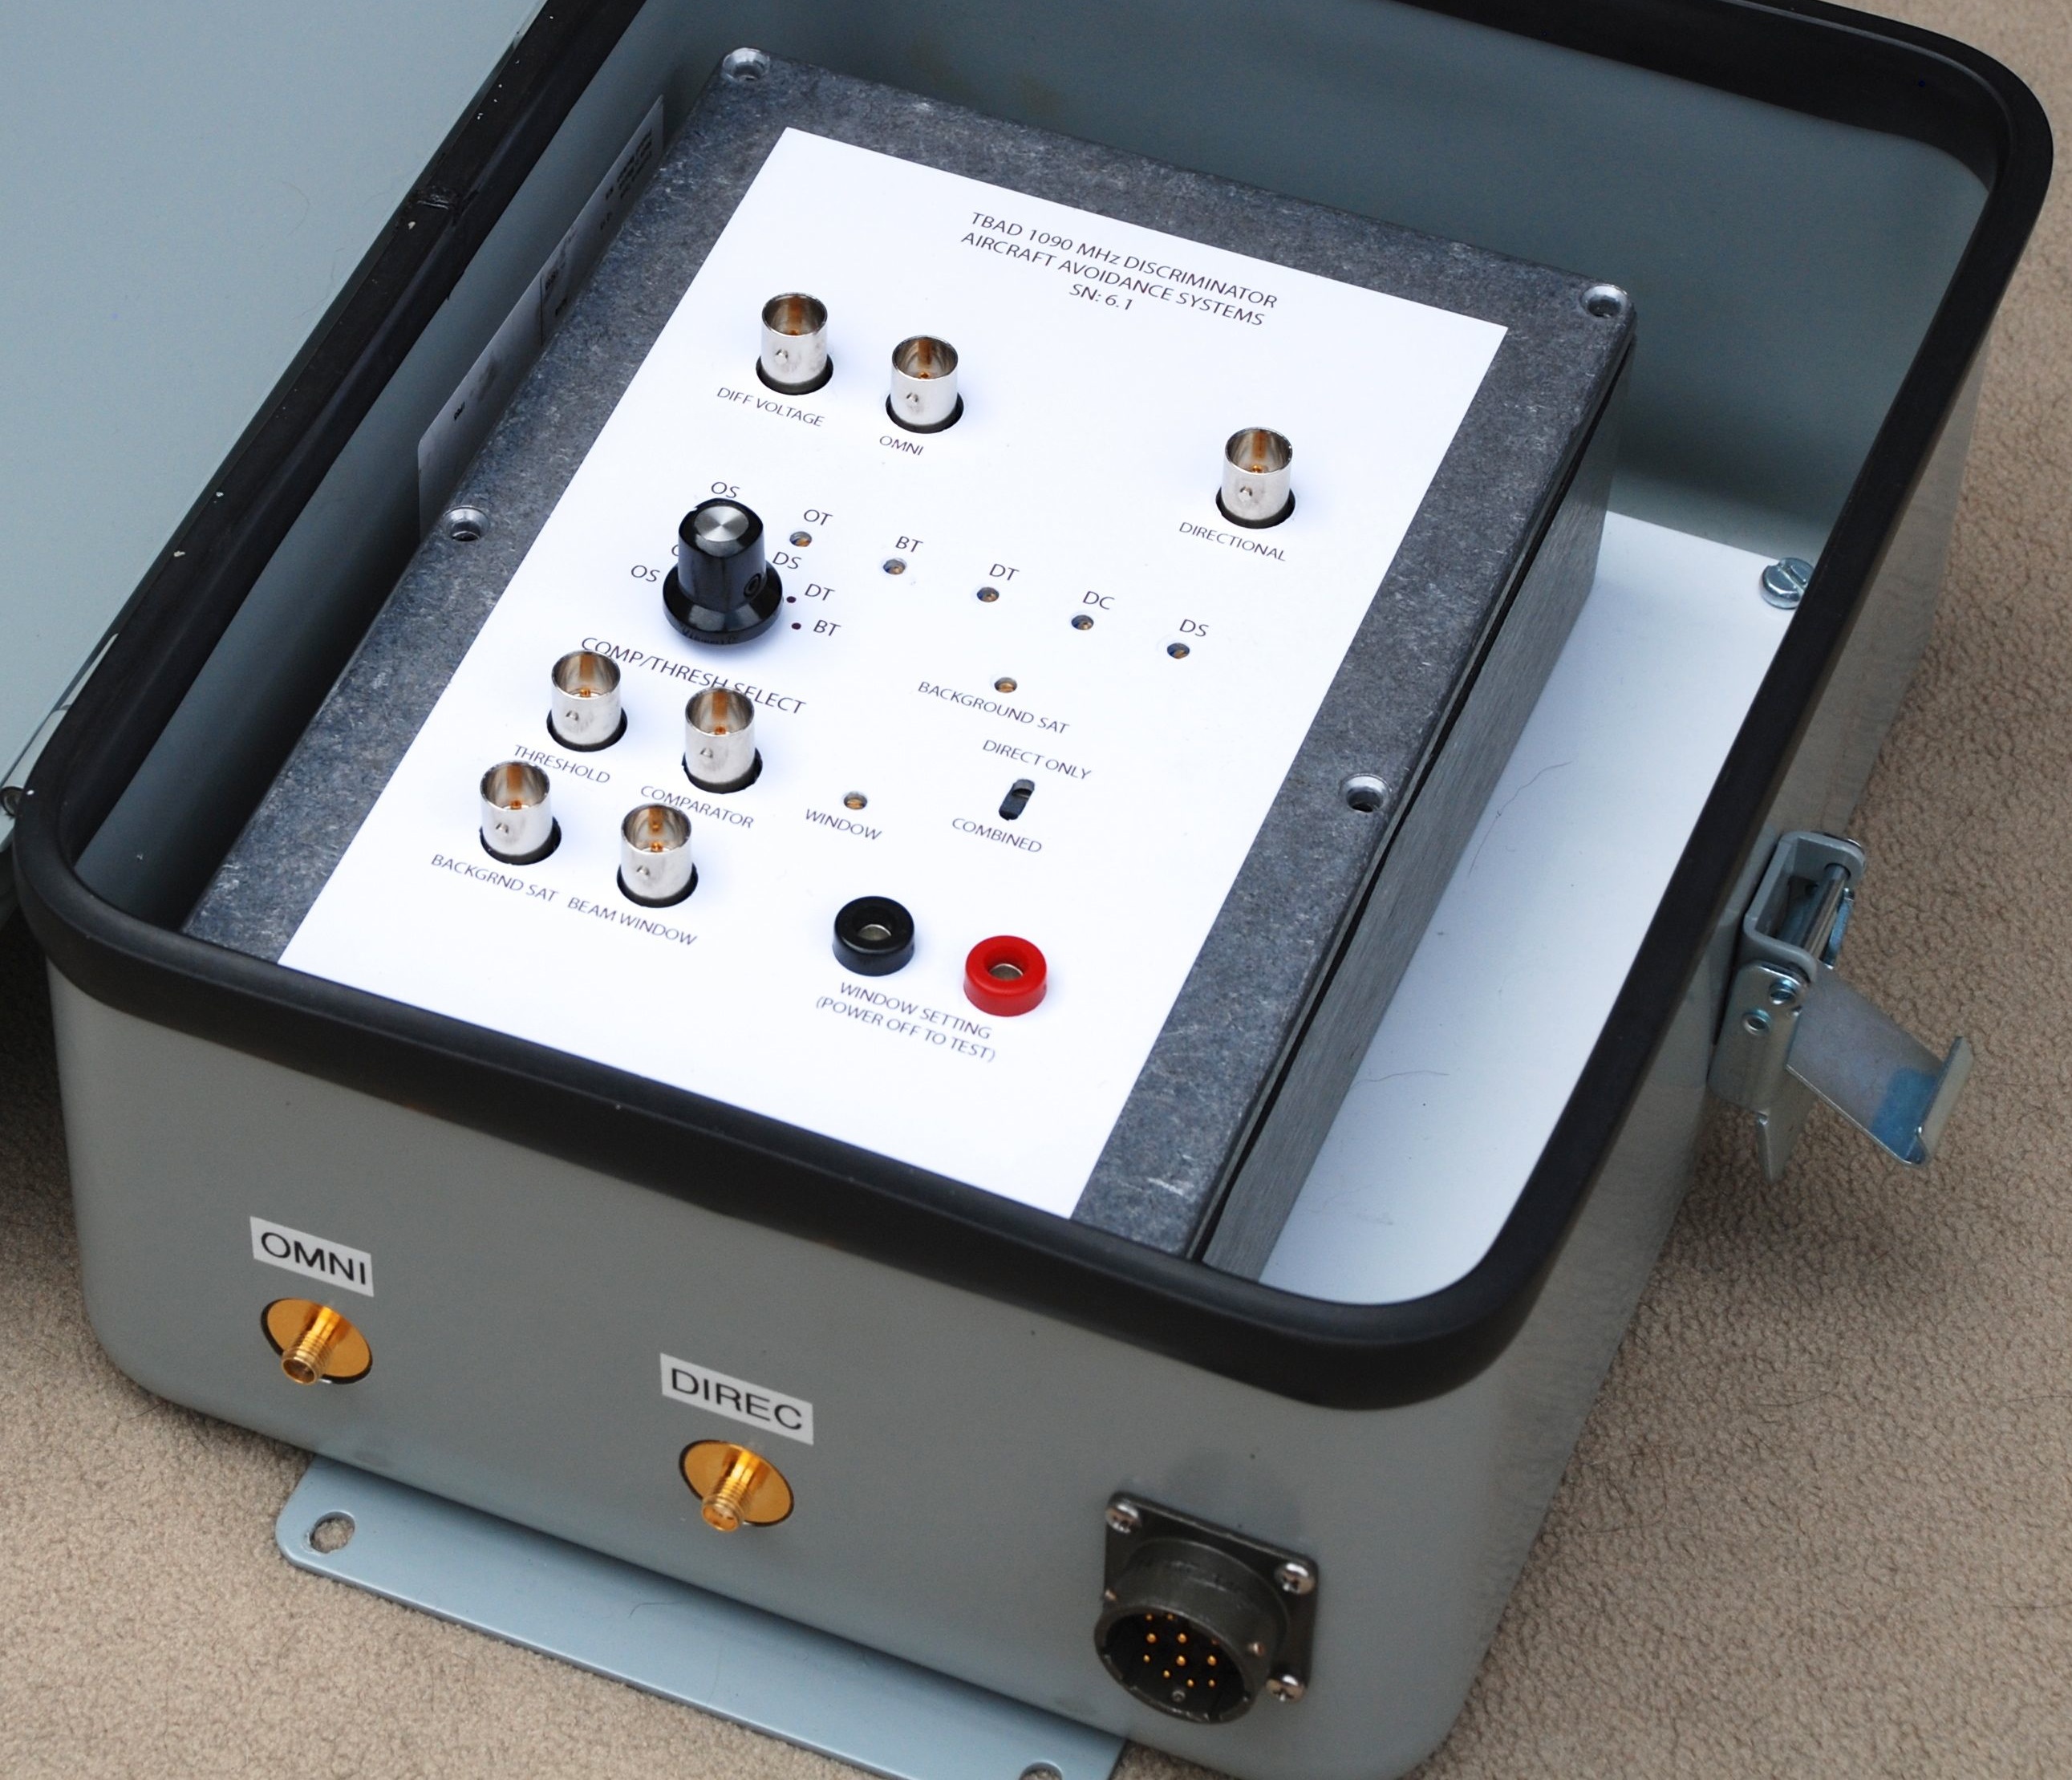 The discriminator unit sits close to the (passive) antenna, having
inputs corresponding to the single patch and array combination. Its job is
to decide if a signal is close to the antenna boresight. Numerous
thresholds control sensitivities (beam threshold, distance sensitivity,
saturation conditions, background requirements, and measures to reduce
false triggers from multi-path interference). Front-panel connectors allow
monitoring and diagnosis during characterization and/or troubleshooting
activities.
The discriminator unit sits close to the (passive) antenna, having
inputs corresponding to the single patch and array combination. Its job is
to decide if a signal is close to the antenna boresight. Numerous
thresholds control sensitivities (beam threshold, distance sensitivity,
saturation conditions, background requirements, and measures to reduce
false triggers from multi-path interference). Front-panel connectors allow
monitoring and diagnosis during characterization and/or troubleshooting
activities.
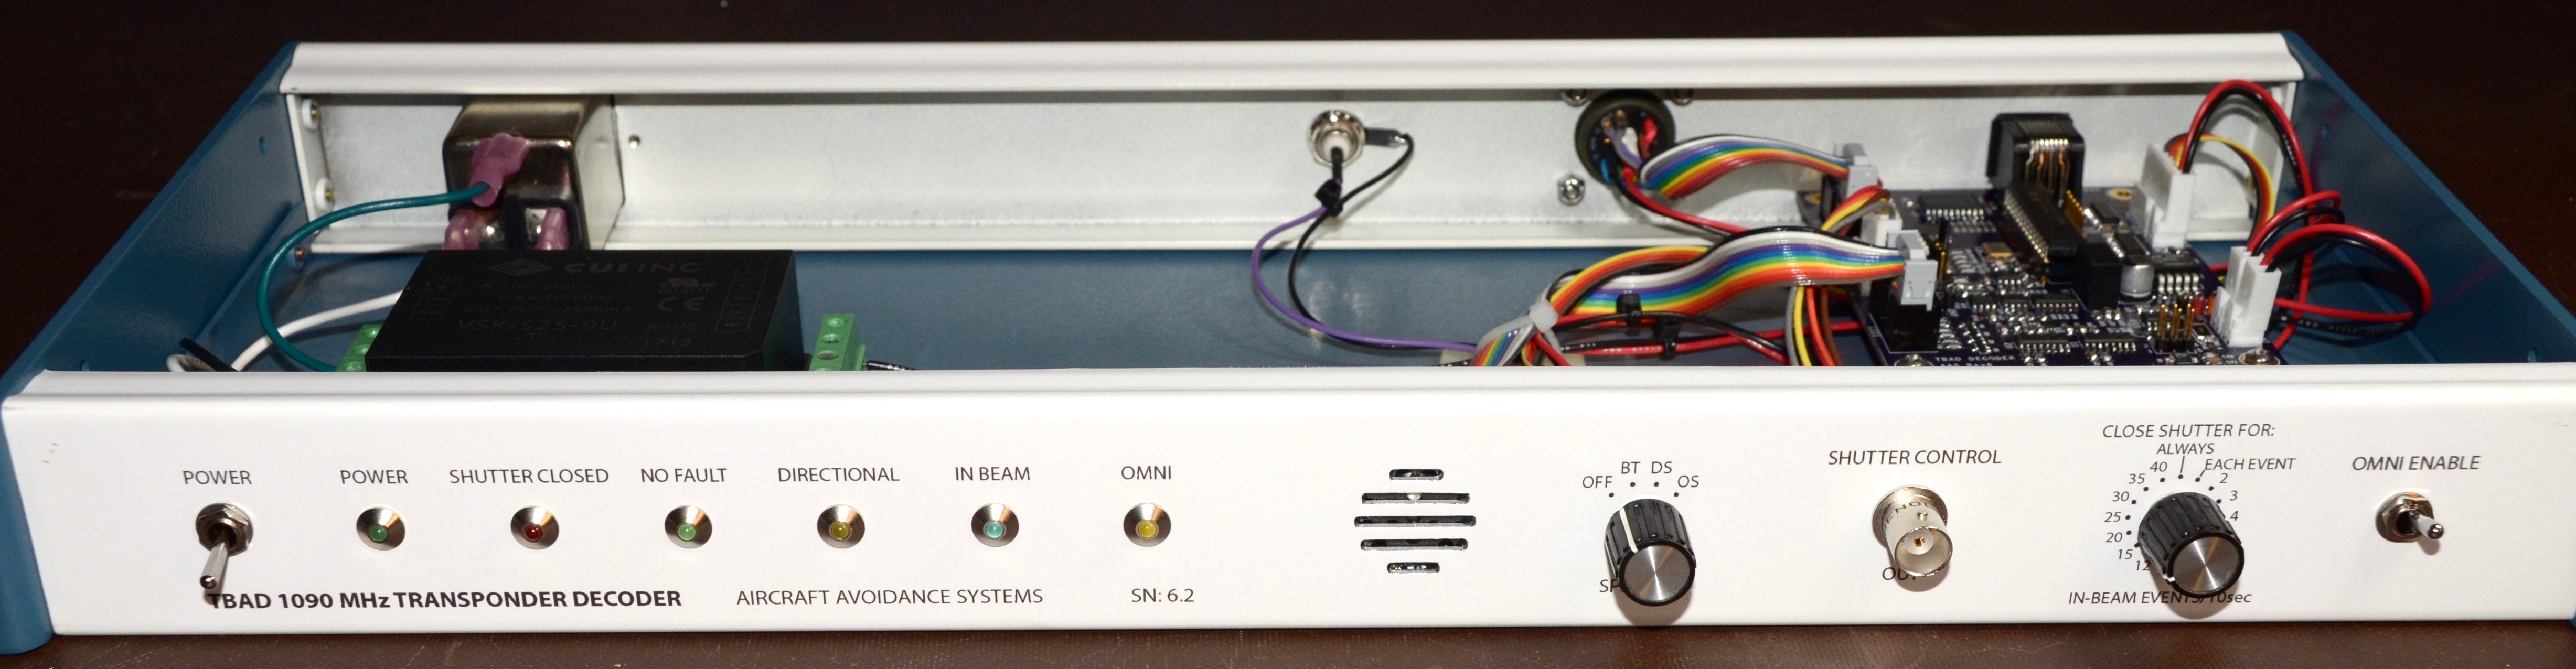
While the discriminator (above) needs to be close to the antenna and is
in a weather-tight box, the decoder is a rack-mount unit that can be tens
of meters away, connected by a single data+power cable. The decoder
interprets the discriminator outputs (threshold-based information) and
applies varying levels of decision-making about whether to close the
laser shutter (via TTL-level output). The micro-controller provides a
robust and low-level interface (no operating system). Serial data is
exported for logging purposes, but TBAD relies on no external connection
for performance of its protective services. LEDs and a speaker on the
front panel provide indications of aircraft activity, and some system
settings are also accessed here.
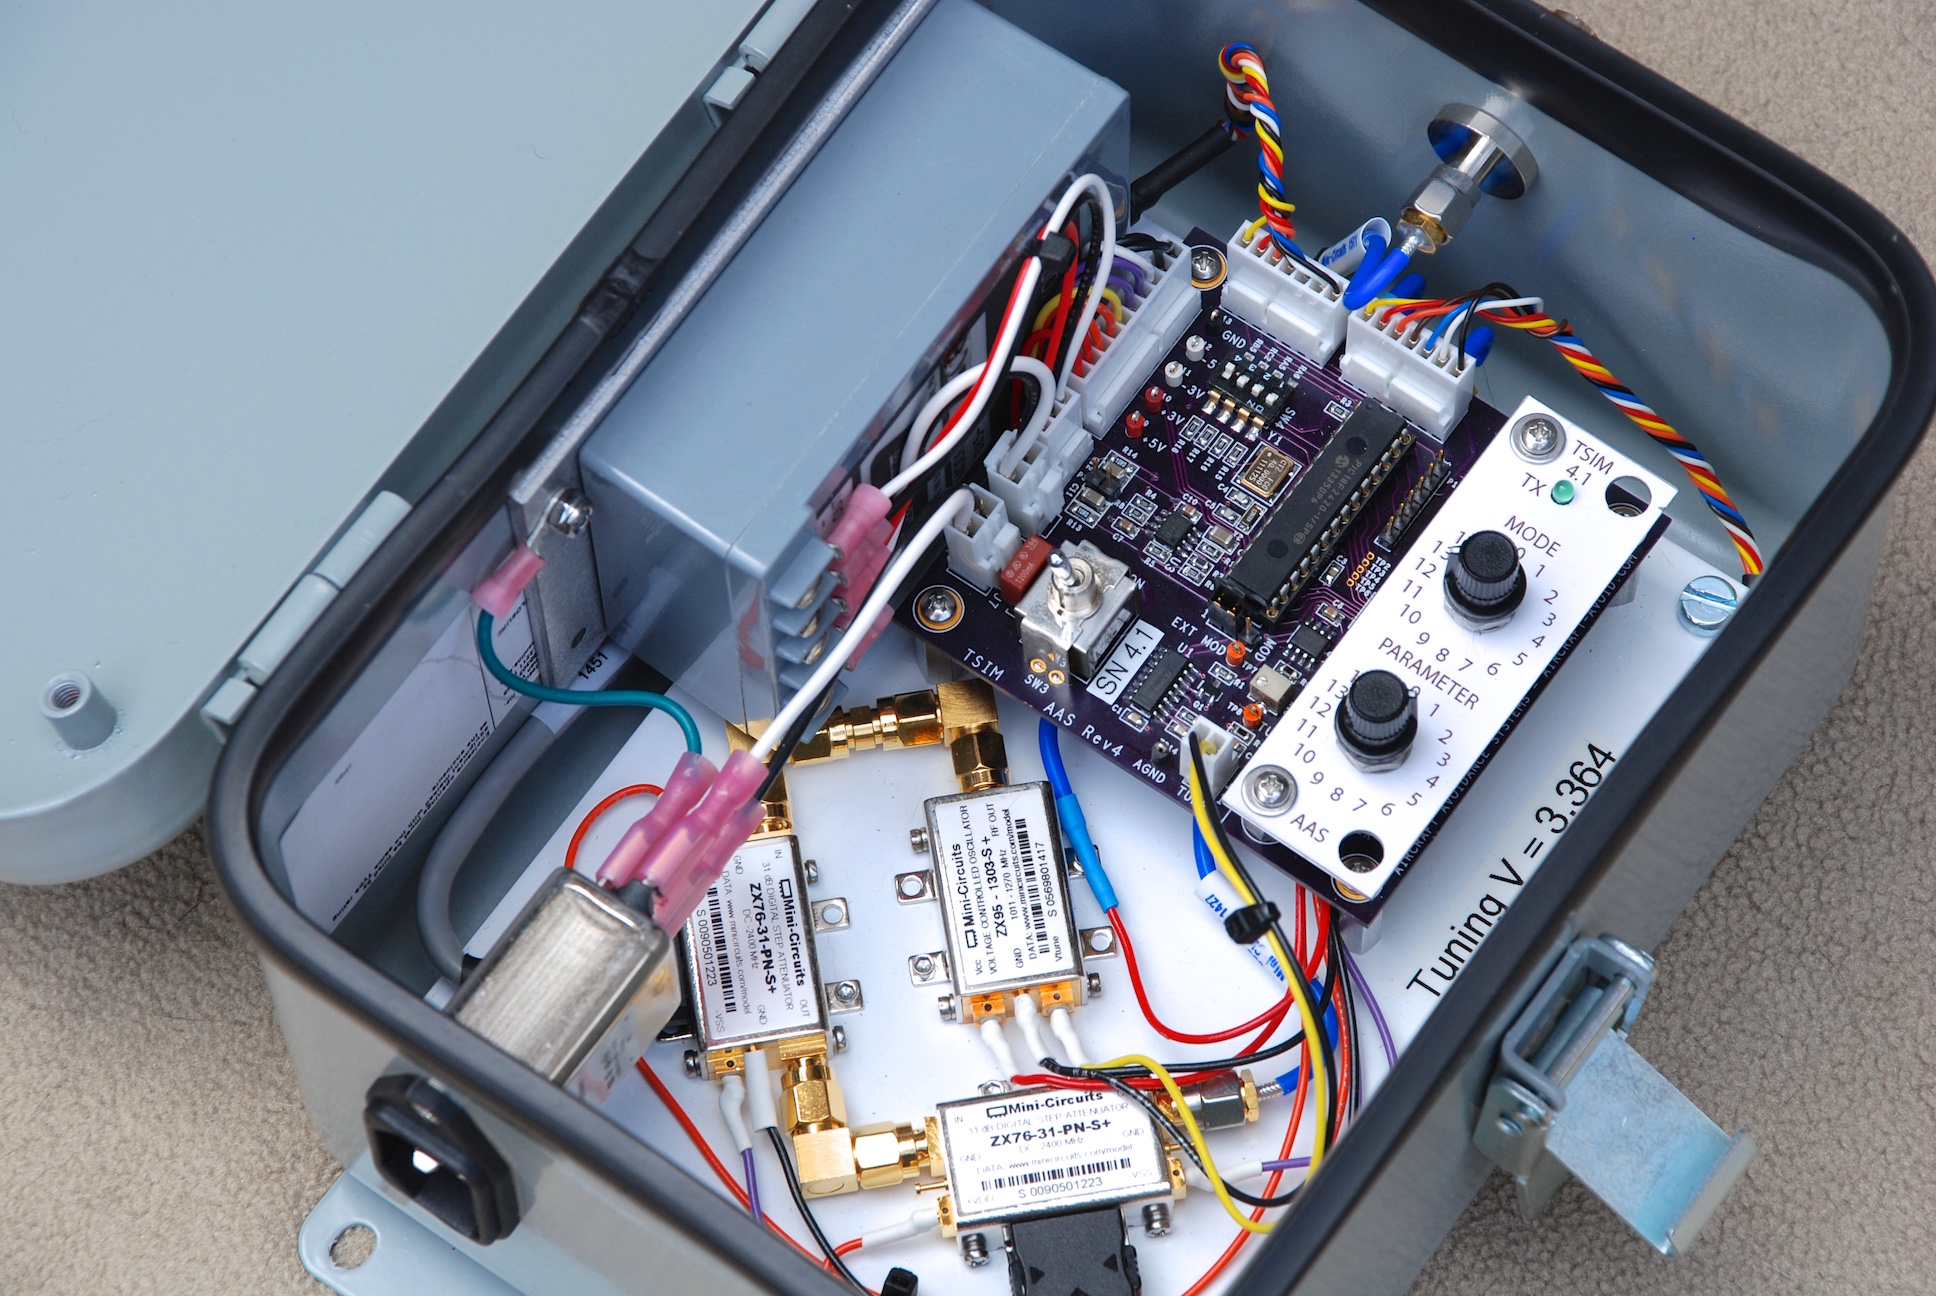 TSIM generates RF signals mimicking transponder signals from aircraft,
albeit at a very low power appropriate to direct connection to the
discriminator or free-space transmission to the TBAD antenna over a
few-meter distance. TSIM produces signal levels varying by six
orders-of-magnitude so that TBAD's reaction to near and distant aircraft
may be judged. A transmitting patch antenna can be affixed near the TBAD
antenna such that periodic validation of TBAD sensitivity and response can
be compared to baseline performance.
TSIM generates RF signals mimicking transponder signals from aircraft,
albeit at a very low power appropriate to direct connection to the
discriminator or free-space transmission to the TBAD antenna over a
few-meter distance. TSIM produces signal levels varying by six
orders-of-magnitude so that TBAD's reaction to near and distant aircraft
may be judged. A transmitting patch antenna can be affixed near the TBAD
antenna such that periodic validation of TBAD sensitivity and response can
be compared to baseline performance.
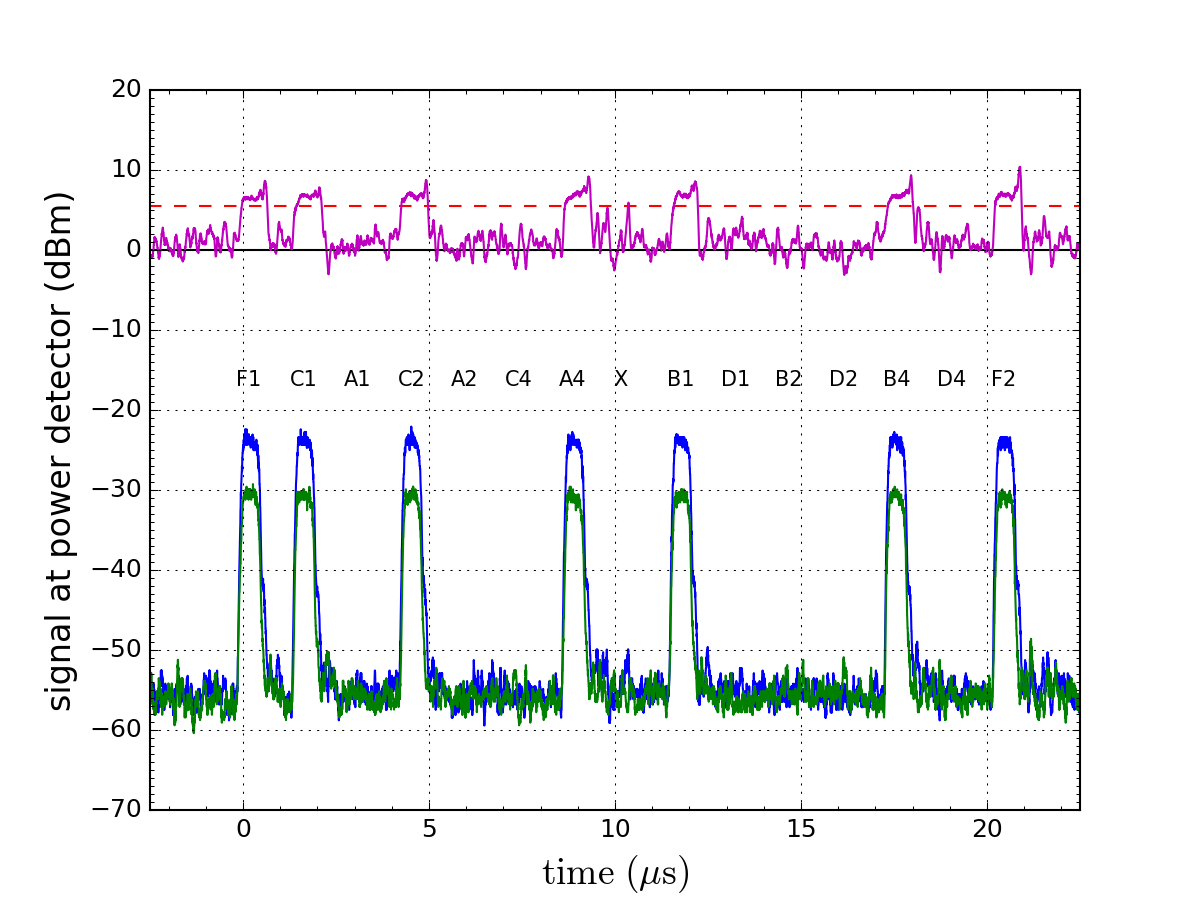 Most of the transponder traffic at present is in the form of Mode A
(temporarily-assigned ID among 4096 choices) or Mode C (encoded
altitude). This is a primitive adaptation to the World War II era Friend
or Foe identification scheme (see synopsis of transponder codes page).
Here we have an example capture of such a code by TBAD, after roughly
35 dB of amplification. The blue curve is
the directional (array) signal, and the green
curve is the single-patch ("omni") signal.
Most of the transponder traffic at present is in the form of Mode A
(temporarily-assigned ID among 4096 choices) or Mode C (encoded
altitude). This is a primitive adaptation to the World War II era Friend
or Foe identification scheme (see synopsis of transponder codes page).
Here we have an example capture of such a code by TBAD, after roughly
35 dB of amplification. The blue curve is
the directional (array) signal, and the green
curve is the single-patch ("omni") signal.
Pulses are 0.45 μs in duration on a 1.45 μs cadence, their presence or absence indicating whether a bit is present. Valid signals always "light up" the first and final framing pulses (F1 and F2), and never the "X" position in the middle. Otherwise this signal reads 4530 (A, B, C, D digits). This could be the Air Traffic Control (ATC) assigned temporary ID (dialed in manually by the pilot on the transponder), or it also happens to map to altitude of 3400 ft. About a third of the codes map to altitudes, and nothing in the signal indicates which type is which—unless there is no corresponding altitude mapping in which case it must be the "squawk" ID code.
The magenta curve is the ratio between the
signals (or just difference in dB space). When this pops above some
threshold (like 5.5 dB as shown here by the red dashed line),
simultaneously satisfying a power threshold on the directional signal (to
eliminate triggers from noise and too-distant planes at low elevation
angles), an aircraft is deemed to be "in-beam". In this case,
the airplane is clearly in the central beam and constitutes a closure
condition.
This is a sample of what TBAD data looks like, showing a variety of features. The green text represents serial characters sent by TBAD (at 115,200 baud); everything else is added by the Python code that reads the TBAD stream and packages it into a log file with added interpretive information.
date/time from log CPU  green from TBAD  alt.          azim  elev  dome
2014-10-27 03:33:09.222 o1524...HF.FCB  34000          7.66  51.06 O
2014-10-27 03:33:09.227 o6667...HF.FD8  -----          7.66  51.06 O
2014-10-27 03:33:09.242 o6667...HF.FD8  -----          7.66  51.06 O
2014-10-27 03:33:09.272 o1524...HF.FCB  34000          7.66  51.06 O
2014-10-27 03:33:09.314 o02E195B8F20C6C..BHF..1F       7.66  51.06 O
    DF-00: parity pass; ID A4063D, Alt 34000
2014-10-27 03:33:09.447 o8DA4063D90AF81C7C09A6ADE3AE6..BHF..78 7.66 51.06 O
    DF-17: parity pass; ID A4063D, Alt 34000, Lat=32.67041, Lon=-105.82855
2014-10-27 03:33:09.668 o8DA4063D99459308380400426AC9..BHF..00 7.66 51.06 O
    DF-17: parity pass; ID A4063D, vel 407; hdg 279; vrate -64; dh=0
2014-10-27 03:33:09.705 o1524..BHF.FDF  34000          7.66  51.06 O
2014-10-27 03:33:09.809 o6667..BHF.FEC  -----          7.66  51.06 O
2014-10-27 03:33:10.095 o6667..BHF.FEC  -----          7.66  51.06 O
2014-10-27 03:33:10.111 o6667..BHF.FEC  -----          7.66  51.06 O
2014-10-27 03:33:10.118 s1524..BHF.FDF  34000          7.66  51.06 O
Four basic types of transmissions are represented here. Mode A and Mode C codes look similar: short four-digit codes—here either 6667 or 1524. Only the latter maps to an altitude (and a reasonable one), so it is identified as Mode C while the 6667 code must be the Mode A ID code.
A Mode S transmission is seen in the fifth row (56 bits represented as 14 hexadecimal characters). In this case, we learn that the permanent aircraft ID is A4063D (in red), which happens to be a Boeing-767 operated by American Airlines (tail number N359AA). This particular Mode S transmission also conveys altitude information (in agreement with the Mode C result: 34,000 ft). Other information/formats are possible under Mode S.
The richest information is contained in the two long codes, which correspond to ADS-B transmissions: 112 bits represented as 28 hex characters. The two examples here also carry (shown in red) the permanent airframe ID, but one of them carries 3-D GPS coordinates of the airplane, while the other communicates speed and heading information.
The other thing to pay attention to is the blue B symbols, indicating that TBAD thinks the transmissions originated from within the protected beam zone. Note that this sequence shows a transition from out of the beam (no B symbols: just a dot in its place) to consistently in the beam. In this instance, TBAD was configured to close the shutter if more than 8 B events happen within ten seconds. The leading 's' character in the TBAD transmission indicates that the shutter closed (was 'o' for open before) on the eighth B event—less than a second after the first B event was registered.
Telescope telemetry information is added in this example, so that we can track where the TBAD antenna is pointed in the sky.
See also the TBAD data interpretation document
(PDF) for more details on interpreting TBAD information.
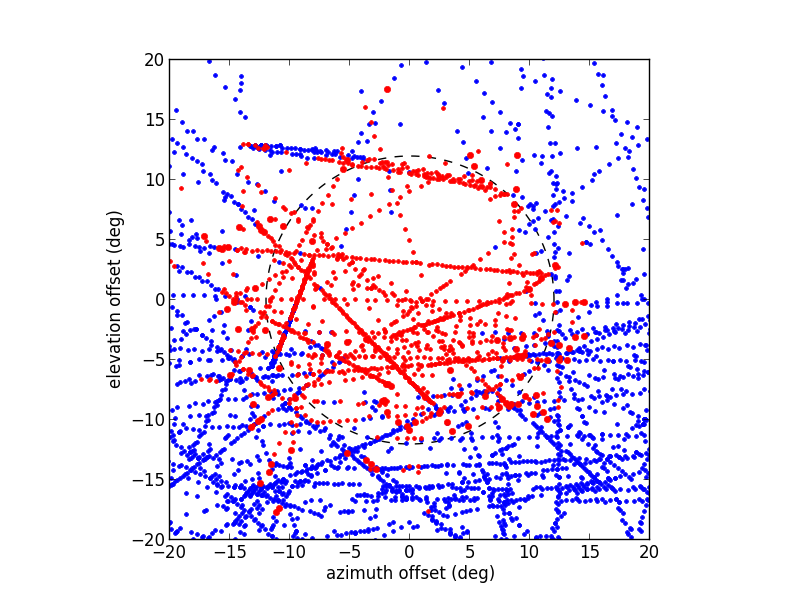 By collecting latitude and longitude information from ADS-B transmissions
and combining this information with telescope pointing information, it is
possible to make a view of the sky as seen by TBAD. This image shows a
compilation of many flight tracks crossing in front of the Apache Point
installation. Red dots represent ADS-B lat/lon
transmissions that TBAD deemed to be in the protected zone/beam. Blue dots were noted (recorded) by TBAD, but not judged
to constitute a closure condition. The striking pattern here is that
central points are red. A circle of radius 12° acts as a
guide: except for fuzziness near the edge, transmissions within 10°
of boresight were tagged as being "in the beam."
By collecting latitude and longitude information from ADS-B transmissions
and combining this information with telescope pointing information, it is
possible to make a view of the sky as seen by TBAD. This image shows a
compilation of many flight tracks crossing in front of the Apache Point
installation. Red dots represent ADS-B lat/lon
transmissions that TBAD deemed to be in the protected zone/beam. Blue dots were noted (recorded) by TBAD, but not judged
to constitute a closure condition. The striking pattern here is that
central points are red. A circle of radius 12° acts as a
guide: except for fuzziness near the edge, transmissions within 10°
of boresight were tagged as being "in the beam."
Note that accompanying the ADS-B transmissions (shown here) are loads of
Mode A, C, and S transmissions (not shown here), providing TBAD
with even more opportunities to trigger. Also worth noting is that TBAD
will keep the shutter closed for as long as there are a certain number of
"in-beam" events within the last ten seconds, and not release the
shutter for another ten seconds after this condition clears. So even
if there are intermittent blue dots in the middle, they do not
constitute a safety issue: TBAD is convinced by all the preceding events
that the shutter should stay closed.
Under construction; more to come...